You are using an out of date browser. It may not display this or other websites correctly.
You should upgrade or use an alternative browser.
You should upgrade or use an alternative browser.
The Credit Crunch (Visualised)
- Thread starter Long Saulty Seagull
- Start date
More options
Who Replied?Uncle C
Well-known member
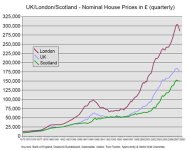
Here are my two favourite graphs.
See how the house price graph mirrors the conventional bubble graph.
We have just passed the denial phase and will see a bull trap, possibly that slight increase that occurred in January, before prices fall off a cliff.
See how the house price graph mirrors the conventional bubble graph.
We have just passed the denial phase and will see a bull trap, possibly that slight increase that occurred in January, before prices fall off a cliff.
Attachments

Djmiles
Barndoor Holroyd
Good watch, especially for those of us not 100% sure what's going on!
Hunting 784561
New member
- Jul 8, 2003
- 3,651
Here are my two favourite graphs.
See how the house price graph mirrors the conventional bubble graph.
We have just passed the denial phase and will see a bull trap, possibly that slight increase that occurred in January, before prices fall off a cliff.
Interesting.
Where do the graphs come from ??
Uncle C
Well-known member
Interesting.
Where do the graphs come from ??
Have a look here
http://www.moneyweek.com/investments/property/uk-house-prices-will-plummet-look-at-this-scary-chart-14664.aspx