Got something to say or just want fewer pesky ads? Join us... 😊

Experimental 3-6-1


:J)

Active member
Jul 7, 2003
621
Brighton
I don't want to criticise too much as I do really like his website, but yesterday's game highlighted the limitations of his method.

Looking at the possession and number of chances he surmised that we scraped past Wednesday, whereas supporters from both sides that were at the game seem to suggest that Brighton looked fairly easily the better side and that Wednesday's chances were mostly not of good quality. I noticed the same about the Brentford game when his method suggested that we should have got something from the game. Being there, I didn't see us particularly troubling Brentford at all.

Is this some kind of joke: "Having scraped past Sheffield Wednesday in unconvincing fashion, Brighton‘s ratings suffered a wobble which perfectly illustrates how the E Ratings model values performances above results." How very dare he... :tantrum:


FatSuperman

Well-known member
Feb 25, 2016
2,830
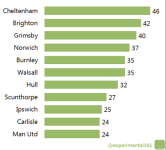
Some interesting updates recently. He's got a chart showing the current number of matches since each club has scored first and then gone on to lose the match. Our last loss after scoring first was 3-2 v Forest in Feb '15. Since then, if we score first, we win or draw.

Currently we have the best record in the Championship, and the second best across all of the leagues.

Scored.png

https://experimental361.files.wordpress.com/2016/10/lasf-ch-2016-10-31.png


whitelion

New member
Dec 16, 2003
12,828
Southwick
Some interesting updates recently. He's got a chart showing the current number of matches since each club has scored first and then gone on to lose the match. Our last loss after scoring first was 3-2 v Forest in Feb '15. Since then, if we score first, we win or draw.

Currently we have the best record in the Championship, and the second best across all of the leagues.

View attachment 79088

https://experimental361.files.wordpress.com/2016/10/lasf-ch-2016-10-31.png

This season we've scored first nine times and won all nine. The opposition have scored first four times and we have drawn two and lost two. There have been two scoreless draws.

It's essential we score first and statistically go on to gain the three points. We don't seem to recover well from losing positions.


Postman Pat

Well-known member
Jul 24, 2007
6,971
Coldean
This season we've scored first nine times and won all nine. The opposition have scored first four times and we have drawn two and lost two. There have been two scoreless draws.

It's essential we score first and statistically go on to gain the three points. We don't seem to recover well from losing positions.

Against Reading and Preston, despite going behind we managed to lead 2-1 in both of those games, but ended up drawing. We aren't too bad.... with Gus in charge we had no hope when we went 1-0 down.


whitelion

New member
Dec 16, 2003
12,828
Southwick
Against Reading and Preston, despite going behind we managed to lead 2-1 in both of those games, but ended up drawing. We aren't too bad.... with Gus in charge we had no hope when we went 1-0 down.

It's true that we've improved post-Gus but we still have trouble winning from a losing position.


Gwylan

Well-known member
Jul 5, 2003
31,336
Uffern
Some interesting updates recently. He's got a chart showing the current number of matches since each club has scored first and then gone on to lose the match. Our last loss after scoring first was 3-2 v Forest in Feb '15. Since then, if we score first, we win or draw.

Currently we have the best record in the Championship, and the second best across all of the leagues.

View attachment 79088

https://experimental361.files.wordpress.com/2016/10/lasf-ch-2016-10-31.png

I must be missing something because that was the 29th game of the 2014/15 season. Since then, we had 17 games in that season, 46 last season and 15 in this one - that's 78 games since we last scored first and lost. Have I got something wrong?


Pantani

Il Pirata
Dec 3, 2008
5,445
Newcastle
I must be missing something because that was the 29th game of the 2014/15 season. Since then, we had 17 games in that season, 46 last season and 15 in this one - that's 78 games since we last scored first and lost. Have I got something wrong?

We didn't score first in all 78 games. This is only counting games where we have scored first.


Bozza

You can change this
Helpful Moderator
Jul 4, 2003
55,719
Back in Sussex
I must be missing something because that was the 29th game of the 2014/15 season. Since then, we had 17 games in that season, 46 last season and 15 in this one - that's 78 games since we last scored first and lost. Have I got something wrong?

Games where we don't score first aren't included.

So, of the last 42 games where we scored first, we lost none of them.


FatSuperman

Well-known member
Feb 25, 2016
2,830
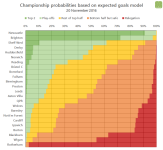
Their model is based on current form so it assumes we continue like this (along with everyone else)

It's based on a combination of chances created, the quality of those chances, the type of chances that we defend against, both successfully and unsuccessfully. It takes into consideration who is yet to play who. Which is why in some circumstances you see aberrations in the graphs - because some teams have harder matches remaining.

It all sounds quite sensible, as predictive models go at least. But you are right of course, if we suddenly dip in form (or even up our game), then over time that will change matters!


Peter Grummit

Well-known member
Oct 13, 2004
6,769
Lewes
The latest forecasts using this model suggests we have a 72% chance of finishing in the top 2.
 

Attachments

  • 2016-11-20-ch-probabilities.png
    2016-11-20-ch-probabilities.png
    14.4 KB · Views: 245


FatSuperman

Well-known member
Feb 25, 2016
2,830
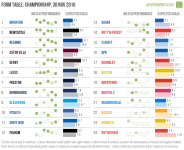
Interesting new graphic up at e361. Shows form, quality chances created, quality chances faced. We are top currently, despite the fact that our performances haven't been the best. There is a Prem one there as well, if anyone was wondering who had the worst form of the PL...

From the site:
Form is something that I’ve wanted to tackle for a while, as most of my graphics are “snapshots” of a particular point in time and don’t tell us much about the direction of travel. What I’ve done is to combine basic information on each club’s last six results with the ‘expected goals’ data that I use to measure chance quality in my match timelines and dashboards. Like many of my graphics,*this is very much a “first pass” and may be refined as time goes on.
Explanation
For each club there are two elements:
The first, headed “Match performance” is a row of six colour-coded circles: dark for a win, light for a draw and hollow for a defeat. However, the circles don’t all sit in a neat line: their vertical position is based on the balance of chances in the match: higher means they created more, lower means they created less and there’s a horizontal line behind each row of dots to indicate where a perfectly balanced match would sit. The point of doing this is to identify whether a club’s performances are in line with their results, and also to pick up any potential trends in performance that the results alone may be masking.
The second, headed “Expected goals”, totals up and compares the quality of chances across the last six matches using two bars. The upper bar is darker and counts up the ‘expected goals’ value of all the opportunities created and the lower, lighter bar counts up the quality of chances allowed. This is intended to give a broader picture of what’s been going on at both ends of the pitch and how attack and defence compare, which I found was hard to glean from the bubbles alone.
In each graphic the clubs are sorted first by points earned in the last six matches and then by their ‘expected goal’ difference.

2016-11-30-ch-form.png


Albion and Premier League latest from Sky Sports


Top
Link Here